
At a glance
Our international network, access to high-growth markets and balance sheet strength help us deliver long-term value for our stakeholders.
Our operating model consists of four global businesses and a Corporate Centre, supported by HSBC Operations, Services and Technology, and 11 global functions.
For year ended 31 December 2018
At 31 December 2018
Strategy highlights
- All four global businesses grew adjusted revenue in 2018
- Increased customer numbers and captured market share in our scale markets
- Grew adjusted revenue in Asia by 11%, and transaction banking revenue by 14%
- We have improved capital efficiency, growing revenue and lending faster than risk-weighted assets
- Return on tangible equity of 8.6%, up from 6.8% in 2017
Group Chairman’s statement
“HSBC is in a strong position. Our performance in 2018 demonstrated the underlying health of the business and the potential of the strategy that John Flint, our Group Chief Executive, announced in June.”
Mark E Tucker, HSBC Group Chairman
19 February 2019
Group Chief Executive’s review

“Revenue growth in our four global businesses helped deliver higher Group reported and adjusted profit before tax. Group return on tangible equity – our headline measure – was also up significantly from 6.8% in 2017 to 8.6%. This is a good first step towards meeting our return on tangible equity target of more than 11% by 2020.”
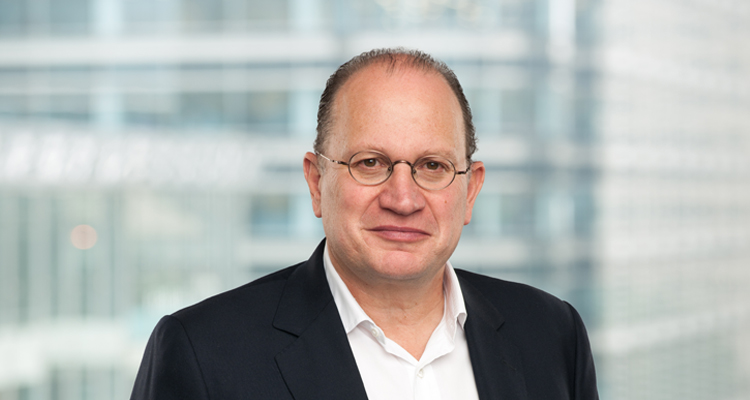
John Flint, HSBC Group Chief Executive
19 February 2019

Our businesses
Retail Banking and Wealth Management
Commercial Banking
Global Banking and Markets
Global Private Banking

Our strategy
Our industry continues to be affected by several long-term and global trends:
Trade growth
Global trade growth is expected to continue and trade within regions is expected to be a key driver, accounting for more than 40% of goods volume growth.
Increasing connectivity
The world is expected to continue to become more connected as global flows of trade, finance and data continue to grow.
Global middle classes
Half of the world’s population is now considered middle class or wealthier, and this proportion is expected to grow to approximately two-thirds by 2030. Almost nine in 10 of the next billion middle-class consumers will be Asian.
Low-carbon investment
Climate change is accelerating and global temperatures are trending significantly higher. Investment in renewable energy capacity will be needed to limit the global temperature increase to 2 degrees Celsius.
Financial targets
Return on tangible equity (%)
Our target is to achieve a reported return on tangible equity (RoTE) of more than 11% by the end of 2020. We intend to do this while maintaining a common equity tier 1 ratio of greater than 14%.
RoTE is calculated as reported profit attributable to ordinary shareholders less changes in goodwill and the present value of in-force long-term insurance business, divided by average tangible shareholders’ equity. A targeted reported RoTE of 11% in 2020 is broadly equivalent to a reported return on equity of 10%.
In 2018, we achieved a RoTE of 8.6% compared with 6.8% in 2017.
Adjusted jaws (%)
Adjusted jaws measures the difference between the rates of change in adjusted revenue and adjusted operating expenses. Our target is to maintain positive adjusted jaws on an annual basis, while noting the sensitivity of the impact on adjusted jaws of unexpected movements in revenue or operating expenses growth.
Positive jaws occurs when the percentage change in revenue is higher than, or less negative than, the corresponding rate for operating expenses.
In 2018, adjusted revenue increased by 4.4% and our adjusted operating expenses increased by 5.6%. Adjusted jaws was therefore negative 1.2%.

Dividends
We plan to sustain ordinary dividends at the current level for the foreseeable future. Growing our dividend will depend on the overall profitability of the Group, delivering further release of less efficiently deployed capital and meeting regulatory capital requirements in a timely manner.
To achieve these financial targets by 2020, we aim to deliver mid-single digit growth in revenue, low- to mid-single digit growth in operating expenses, and approximately 1-2% annual growth in risk-weighted assets. Given the current economic environment, we will seek to offset some or all of any possible weaker-than-planned revenue growth with actions to manage operating expenses and investments.
Video
HSBC Group Chief Executive John Flint discusses the Group’s performance in 2018 and the outlook for the year ahead.
Downloads
Notes
1 Revenue from international clients is derived from an allocation of adjusted revenue based on internal management information. International clients are businesses and individuals with an international presence.
2 Adjusted basis, geographical view; Group total and regional % composition excludes Holdings; regional % composition calculated with regional figures that include intra-Group revenues.